2010 Foreclosure Stats
There was a noticeable drop in foreclosure filings in March of 2010 from the 600-800/mo range through the end of the year which came in at it's lowest point in November with only 176 initial filings. This is very good news.
However, there are several variables which may explain why the sudden drop. The obvious would be the "Robo-signer" issue banks. Many of the states' attorneys generals are probing the foreclosure shops for fraudulent filings of documents. There are reports from around Florida of cases being dismissed by the banks for unknown reasons. Could it be further acknowledgement that many of these foreclosure cases are not winnable when properly defended. I don't know but eventually, it will come out.
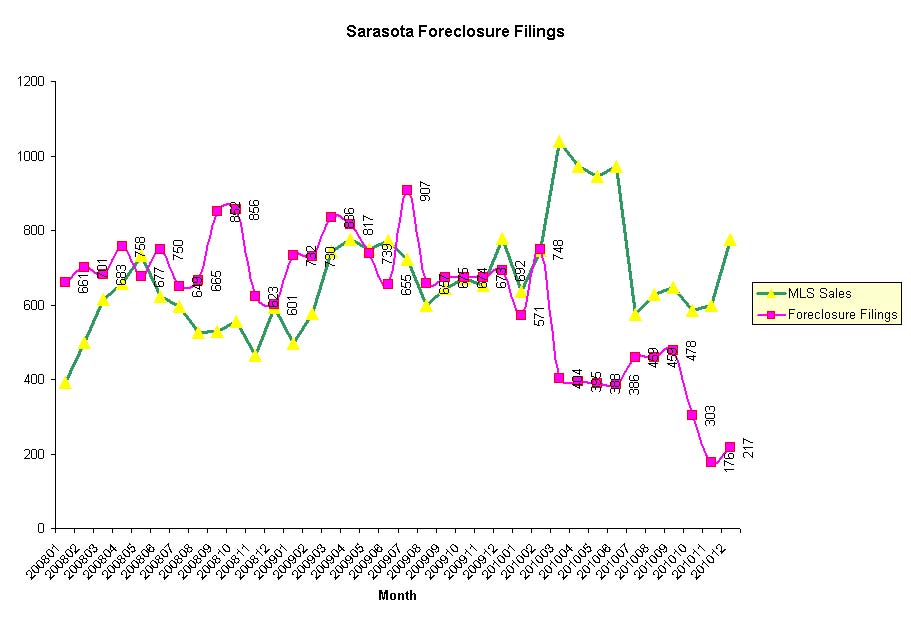
Along with the foreclosure filings, I also like to plot a total residential sales line from the MLS for comparative reasons. Since mid 2008 until the Obama tax break for homebuyers program launched in March, foreclosure filings rant at or slightly more filings than sales. Not a good thing. Sales have returned to the levels prior to the incentives. What is encouraging is the drop in foreclosure filings.
What the chart does not say is the effect on pricing (more on that in a future post). Prices are generally still down over all but the rate of decrease has diminished greatly. In fact, the increase in interest rates and tightening rental market may indicate the bottom. As written before, the probability interest rates and prices bottoming at the same time are almost impossible. The other missing component in this chart is the huge backlog of "in process" foreclosures. Even with the balance of sales exceeding initial foreclosure filings, it will be years before we are balanced.
Expect pricing to level and bounce here for a while. Of course there are several external issues that could effect the market. Four dollar gas, the robo signing issue, and a host of other issues could impact this market.
Stay tuned! We are!
FWZ9DUY8QH5W

